

TL;DR
- Engineering productivity starts with delivery metrics. DORA, cycle time, deployment frequency, defects, and rework show how efficiently software moves through development and production.
- Those metrics don’t explain the resources behind delivery. Developer capacity, cloud infrastructure, tooling, AI consumption, testing, and remediation can change the economics even when delivery metrics improve.
- The work itself provides the missing connection. Following a feature from requirement through engineering, code, testing, deployment, rework, and production makes each metric part of the same delivery story.
- The final question is what the work produced. Cost, quality, delivery performance, and business impact need to be evaluated against the software actually delivered.
- A cost-and-outcome ledger connects the entire chain. It gives engineering leadership one view of productivity, delivery economics, and outcomes instead of disconnected signals.
Every quarter, engineering leadership brings a familiar set of numbers into the business review: deployment frequency, cycle time, change failure rate, defects, rework, and team capacity.
Then come the harder questions:
Did productivity actually improve? Where did the investment go? Should we add capacity, fund modernization, or change the delivery model?
A team can double deployment frequency while increasing cloud consumption, QA effort, AI tooling, or remediation. McKinsey’s 2026 research found 80% of respondents reporting improved individual productivity from AI, while only 37% reported a positive impact on organizational EBIT.
For CIOs and CTOs, the answer starts with the metrics already used to run engineering—but cannot stop there. Productivity needs the cost of producing software, the quality of what reaches production, and the business value created by delivery.
That changes the conversation from measuring activity to measuring the economics and outcomes of engineering work. It also creates a path toward an outcome-based delivery model, where accountability moves beyond hours and headcount to measurable engineering results.
What this article covers
- DORA and Engineering Productivity Metrics: What they reveal about throughput, stability, flow, and engineering performance.
- The cost-and-outcome layer: How capacity, infrastructure, AI tooling, quality, rework, and delivered software change the productivity equation.
- Outcome-based delivery: How enterprises can tie engineering investment to measurable delivery results instead of hours and headcount.
Engineering Productivity Metrics Start With Delivery Performance
When engineering leaders talk about productivity, DORA usually enters the conversation first. The reason is practical: its metrics measure the software delivery system rather than trying to score individual developers.
The current DORA framework looks at five measures across two dimensions:
| Dimension | Metric | What it tells leadership |
| Throughput | Change lead time | How quickly a code change moves into production |
| Deployment frequency | How often teams successfully deploy | |
| Instability | Change failure rate | How often deployments require remediation |
| Failed deployment recovery time | How quickly teams recover from failed deployments | |
| Deployment rework rate | How much deployment activity goes toward correcting user-impacting issues |
Together, the measures give leadership a much better view of delivery health than metrics such as lines of code, commits, or tickets closed.
But enterprise engineering rarely stops at production throughput. A platform team may reduce lead time while carrying substantial technical debt. A product team may increase deployment frequency while QA and SRE absorb the additional operational load. A modernization program may report fewer releases while moving a much larger capability out of a legacy estate.
The metric has meaning only in relation to the work behind it.
That brings other engineering productivity metrics into the picture: cycle time, PR review time, defect density, rework, developer capacity, incident volume, and technical debt can explain why delivery performance moved and where engineering effort went.
The challenge is not choosing between DORA and the broader set. It is understanding how the measures interact. A deployment frequency increase means something different when change failure rate falls at the same time than when defects and remediation rise alongside it.
For an enterprise engineering organization, productivity measurement therefore starts with delivery performance but needs to follow the underlying work closely enough to explain the movement.
Engineering Productivity Metrics Must Account for Delivery Cost
A productivity number only becomes meaningful when leadership knows what produced it and what it consumed.
Consider two engineering organizations, both reporting a 25% increase in feature throughput.
- Organization A achieved the increase by removing handoffs, automating testing, improving platform reliability, and reallocating existing capacity.
- Organization B added engineers, expanded its tooling estate, increased cloud consumption, and introduced AI coding agents across development.
The dashboard records the same productivity gain. The economics are very different. That is why productivity needs a denominator.
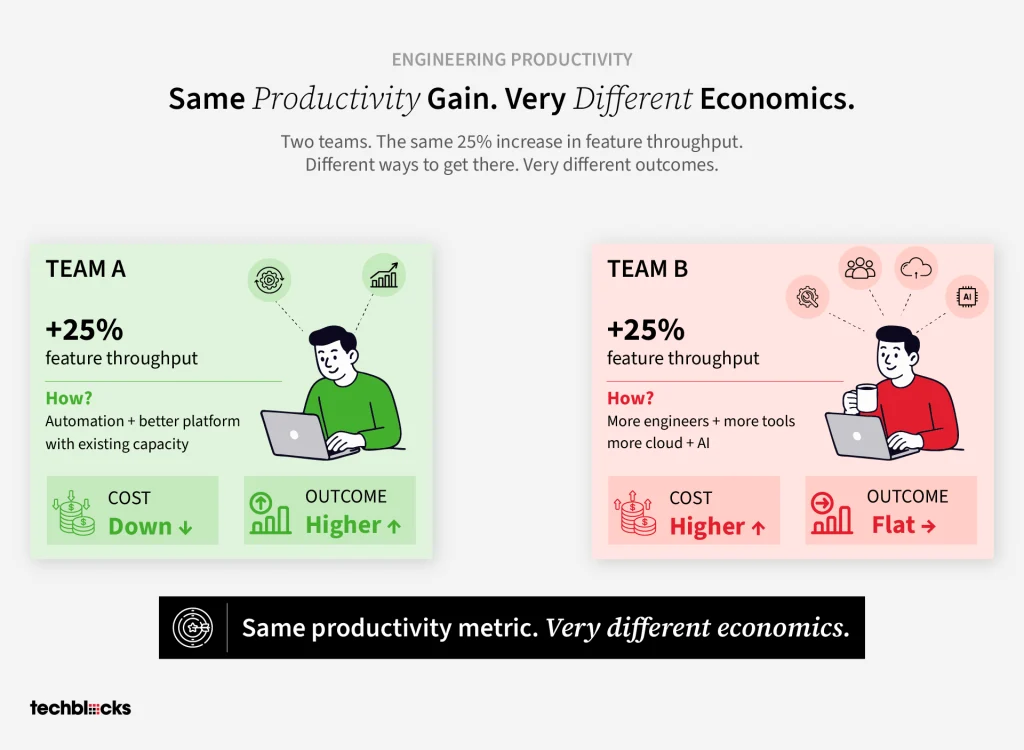
Engineering leaders need to account for the resources behind delivery: developer capacity, architecture and review effort, QA, CI/CD infrastructure, cloud services, AI tools, and the rework required after release. Quality matters here too. A faster delivery cycle loses some of its value when defects, incidents, or remediation consume the capacity supposedly created by the improvement.
The same logic applies to investment decisions. A modernization program may deliver fewer releases than a product team while consuming significant engineering capacity. Yet replacing a critical legacy capability can remove future maintenance costs, reduce operational risk, and unlock capabilities the existing platform cannot support.
Throughput tells leadership how much moved. Cost and quality help explain what it took to move it. Business outcomes determine whether the investment was worthwhile.
Trace Engineering Work Beyond the Deployment
Now that we know what conventional productivity metrics can tell us, there is another problem enterprise engineering leaders regularly encounter: the numbers often describe the outcome of delivery without preserving the story behind the work.
A feature may reach production with a healthy cycle time and a successful deployment. Behind the release, developers may have rewritten generated code, reviewers may have spent additional time validating changes, QA may have expanded test coverage, or engineers may have returned to the same feature after defects surfaced in production.
The deployment metric records the endpoint. It does not preserve the journey.
Across enterprise environments, TechBlocks has seen engineering data spread across Jira, source-control systems, CI/CD pipelines, testing platforms, observability tools, cloud platforms, and AI development tools. Each system captures an important part of delivery, but leadership often lacks a connected view of how one piece of work moved across the engineering lifecycle.
A feature can therefore appear efficient in one system while consuming significant capacity elsewhere.
This problem becomes even more important as AI enters the development workflow. An engineering team may generate code faster, yet spend additional time reviewing, testing, correcting, or rewriting AI-assisted output. AI usage also introduces a new cost layer through model consumption, agent usage, licenses, and infrastructure.
TechBlocks built AiDE to address this problem. AiDE is a first-of-its-kind AI-native operating model for measuring, governing, and delivering software engineering outcomes in the agentic era.
In practical terms, AiDE connects the different pieces of engineering work so leadership can follow a feature from its original requirement through engineering effort, code, AI usage, quality signals, delivery, cost, and business impact. Rather than looking at productivity metrics as isolated numbers, the organization can see how the work behind each result actually unfolded.
Stop Guessing About Productivity
Know Where Your Engineering Investment Actually Goes
Connect scattered delivery data to reveal effort, AI usage, quality, rework, costs, and outcomes.

What the ledger adds to conventional productivity measurement
| Engineering signal | Conventional view | Ledger view |
| Cycle time | How long the change took | Effort and activity behind the change |
| AI contribution | AI usage or generated code | AI-assisted work, developer modifications, and code survival |
| Quality | Defects or failures | Testing, remediation, rework, and post-release changes |
| Delivery | Deployment completed | Work shipped and its production history |
| Cost | Aggregate engineering/tool spend | Cost associated with the individual ticket or delivery unit |
| Outcome | Feature delivered | Business capability delivered and its resulting impact |
The mechanism behind this view is AiDE’s Delivery Ledger. Instead of treating a ticket as simply “done,” the ledger connects its development trail: AI-assisted code, developer modifications, model usage, code survival, shipped work, rework, reversions, token consumption, and cost per ticket.
The shift is subtle but important: the ledger does not replace Engineering Productivity Metrics. It gives them something to explain.
A cycle-time improvement becomes more meaningful when leadership can see the engineering effort behind it, the quality of the resulting code, the rework generated after release, and the cost attached to the delivered work.
The same view changes how AI productivity gets evaluated. Instead of asking only whether developers produced more code or completed more tickets, leadership can ask whether AI reduced delivery effort, whether generated code survived review and testing, whether rework increased, and how much the completed work ultimately cost.
Now productivity has a traceable unit of work behind it.
The conversation can move from “How productive was engineering?” to a more consequential question:
“What did we spend to deliver the work, what survived into production, and what did the business receive in return?”
Once leadership can answer those questions consistently, engineering productivity stops being only a performance measurement exercise. It becomes part of how the organization decides what delivery should cost, what results it should expect, and how accountability should be structured.
Engineering Productivity Metrics Should Lead to Outcome-Based Delivery
Once engineering can trace a piece of work from requirement through production, the organization can evaluate delivery against something more meaningful than the hours spent producing it.
For years, enterprise software contracts have largely treated time and capacity as the unit of delivery. A team is staffed, hours are allocated, and progress is measured against the work completed within those hours.
AI changes the economics of that arrangement. If agents can reduce implementation effort, automate testing, accelerate reviews, or handle parts of the delivery lifecycle, fewer engineering hours can produce more output. The productivity gain is real, but an hourly commercial model does not naturally reward it.
The ledger provides the evidence needed to structure delivery differently.
| Traditional accountability | Outcome-based accountability |
| Hours consumed | Engineering outcomes delivered |
| Headcount assigned | Capacity required to achieve the outcome |
| Scope completed | Validated capabilities delivered |
| Productivity reported separately | Productivity tied to cost and quality |
| AI spend treated as tooling cost | AI consumption included in delivery economics |
| Efficiency measured internally | Efficiency reflected in the delivery commitment |
With AiDE, TechBlocks applies this principle through an outcome-based delivery model built around validated Delivery Units. Baselines for work, cost, throughput, and quality are established upfront, then delivery performance is measured against agreed outcomes rather than simply against effort consumed.
For an enterprise buyer, the difference is practical. If engineering becomes more efficient, the organization should receive more value from the same investment, not simply receive fewer billable hours.
Engineering productivity metrics then become part of the commercial model. DORA can establish delivery performance, the Delivery Ledger can connect effort and cost to individual work, and outcome-based commitments can tie the resulting performance to what the enterprise actually receives.
The question changes from: How many engineering hours did we buy? To: What measurable engineering outcomes did the investment produce?
Conclusion: Make Engineering Performance Accountable to Outcomes
The next step is not to add another layer of reporting. It is to make the engineering system itself easier to understand, improve, and manage.
Start with a delivery stream where the economics are visible enough to establish a baseline. Map the work, connect delivery and quality signals, account for AI and infrastructure consumption, and identify where engineering capacity is creating value, or being lost to rework, technical constraints, or inefficient processes.
TechBlocks can support the transformation at both levels.
- Our Software Development practice brings together AI-native engineering, intelligent architecture, DevSecOps, platform engineering, cloud modernization, automation, and observability to improve how enterprise software is built and operated.
- AiDE adds the measurement and operating model around delivery, connecting engineering activity with cost, quality, AI contribution, and measurable outcomes.
The two capabilities, together, give engineering leadership a practical path from measurement to action: establish the baseline, improve the delivery system, validate the economics, and progressively move accountability toward measurable Engineering Outcomes.
The goal is simple: make every improvement in engineering productivity visible in the value the enterprise receives.
Build an AI-Native Engineering Model for Outcomes
See how TechBlocks combines software development, AiDE, AI delivery, quality, cost, and measurable business outcomes.
Frequently Asked Questions
Create a unified engineering ledger by connecting systems such as Jira, GitHub, CI/CD, cloud, and AI tooling. The resulting baseline can associate engineering effort, infrastructure, tooling, and AI consumption with individual delivery units.
Code survival measures how much AI-assisted code remains in production after developer modification, review, testing, and remediation. A high generation rate means little if substantial rewriting or debugging absorbs the capacity supposedly created by AI.
Start with historical baselines for throughput, quality, delivery cost, and capacity before changing commercial terms. Those benchmarks provide an objective basis for defining validated outcomes, performance thresholds, and commercial accountability.
Trace shared platform, SRE, QA, and remediation effort back to the delivery work generating the demand wherever attribution is technically feasible. The resulting view exposes operational costs often buried within centralized engineering overhead.
Measure technical debt reduction through indicators such as maintenance effort avoided, operational risk reduced, system resilience, remediation volume, and future delivery capacity. Modernization then receives credit for economic and engineering value rather than being judged by feature velocity alone.