

Key Takeaways
- Headcount expansion ceases to be a reliable proxy for productive capacity as scaling introduces coordination drag, dependencies, and architectural debt.
- Low developer hourly rates often mask an unsustainably high cost per outcome driven by manual testing and platform fragmentation.
- Modern engineering centers evaluate delivery velocity, system stability, time-to-value, and business impact rather than tracking resource utilization or billable hours.
- The GCC 3.0 model uses AI-augmented pods, governed Centers of Excellence, and automated workflows to scale velocity without linear cost growth.
- Mature capability centers prioritize systemic engineering leverage over workforce expansion to eliminate operational gridlock and accelerate software delivery.
The global capability center market is expanding rapidly, climbing from $601.25 billion in 2025 to $649.16 billion in 2026. Captive operations generated 57.74% of that market revenue in 2025, driven by aggressive corporate commitments to global delivery networks.
Historically, enterprises built the GCC model on substantial hourly wage arbitrage between domestic and offshore technical talent pools. For example, fully loaded engineering costs in the US average $80 to $150 hourly, compared to $20 to $45 offshore. The differential delivers 40 to 70% labor savings, with the widest cost advantages concentrated across South and Southeast Asia.
Yet an engineering center of two hundred developers operates under fundamentally different economic assumptions than an organization scaling past one thousand.
At enterprise scale, adding headcount stops adding linear capacity as delivery squads accumulate complex dependencies, redundant management, and fragmented tooling. Consequently, the GCC cost structure expands significantly faster than the actual volume of productive engineering capacity delivered to the business.
Headcount stops serving as a dependable proxy for productive software velocity or meaningful business value creation across expanding technological estates. After a point, teams need to determine when scaling a global capability center stops being a workforce expansion challenge and becomes an enterprise operating-model crisis.
The Economics Hidden Behind Headcount
Enterprise technology scorecards often track developer headcount, hourly wages, and seat utilization as proxies for software engineering capacity. The traditional input metrics create a dangerous blind spot for technology executives evaluating global capability center performance at scale. Measuring cost per full-time employee conceals the actual expenditure required to push tested software into production environments. The real net cost involves:
| Headcount | Actual productive engineering capacity |
| Cost per FTE | True cost of delivering a business outcome |
| Resource Utilization | Hidden delivery bottlenecks and deployment queues |
| Hiring Volume | Engineering leverage and output per developer |
| Team Size | Compounding cross-team coordination overhead |
As delivery organizations expand, hidden structural friction from the hidden costs steadily consumes the initial financial margins gained from geographic labor arbitrage, with:
- Duplicated Capabilities: Disconnected teams repeatedly build identical tools, pipelines, and frameworks without coordination from enterprise architecture.
- Manual Quality Assurance: Brittle release workflows and repetitive manual testing cycles delay critical features and inflate engineering labor costs.
- Coordination Gridlock: Engineers spend valuable sprint hours negotiating cross-service dependencies rather than shipping high-value production code for customers.
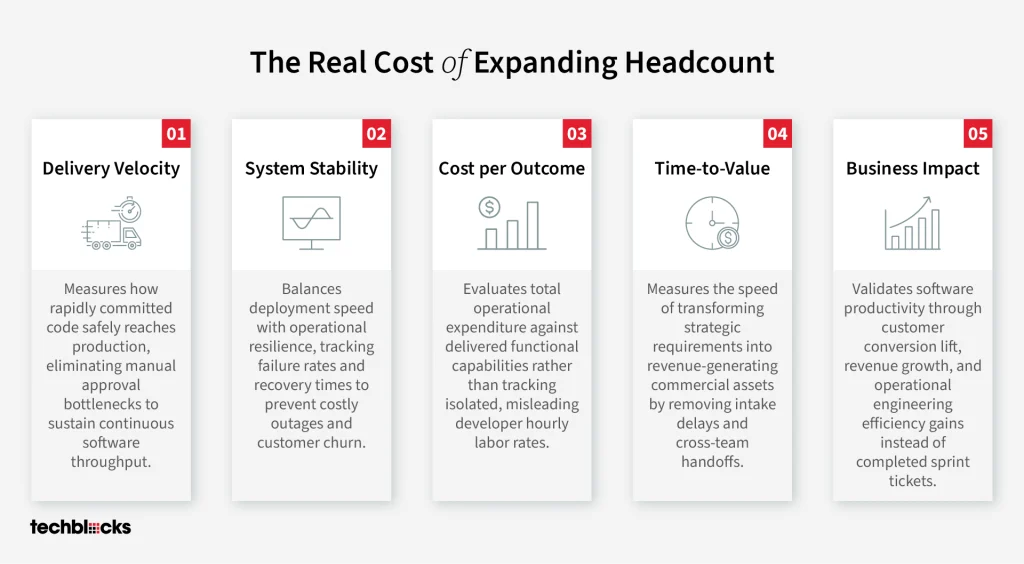
To achieve sustainable GCC cost optimization, enterprises need to evaluate engineering productivity through five outcome-driven telemetry metrics:
Delivery Velocity
Headcount expansion doesn’t always translate into faster software delivery when teams navigate complex architectural dependencies and manual approvals. In a study, 47% of teams identify manual approvals as a major bottleneck that stretches the delivery pipeline without actually boosting throughput.
True engineering velocity tracks how rapidly committed code moves safely from development to live customer environments. Engineering teams need to track the lead time to make changes and the total time for a committed feature to reach live production systems. They also need to keep track of whether CI pipelines push frequent low-risk releases or accumulate delayed batch updates.
System Stability
Low developer rates lose all economic value when fragile releases trigger widespread production outages and severe customer disruption.
Consider this:
A US-based food-delivery enterprise hired a freelance developer team of 6 devs from the Philippines to handle an application release. Each engineer charged $20 an hour, bringing the net investment to $120 an hour and almost $29,000 a month. That cost was about 50% lower than what a local team would have charged.
But post-delivery, the app crashed. Hundreds of customers got stuck in the middle of ordering food or couldn’t log in at all. As a result, the company lost $200 an hour, and one-third of their customer base by the day ended. The situation proves that pocket-friendly isn’t always the best, and sometimes, saving costs in the development stage can cost enterprises a lot more if the system is unstable.
To prevent similar situations, modern capability centers track system resilience metrics to ensure aggressive software delivery does not compromise operational reliability:
- Change Failure Rate: Quantifies the percentage of production deployments that cause immediate service degradation or emergency rollbacks.
- Mean Time to Recovery: Calculates how quickly engineering squads restore core services following an unexpected live operational incident.
Cost per Outcome
Tracking blended hourly rates fails to reveal whether an enterprise is spending capital efficiently across digital product roadmaps. To compensate, enterprises must calculate total operational expenditure against the discrete functional assets delivered to the business and sum up:
- Fully Loaded Delivery Cost: Integrates infrastructure compute, cloud licensing, and quality engineering labor into each delivered product capability.
- Operational Drag Accounting: Uncovers hidden expenses tied to triage meetings, dependency coordination, and ongoing manual rework across squads.
Time-to-Value
Engineering leverage depends directly on how swiftly an organization transforms a strategic requirement into an active commercial asset. Extended intake cycles and sequential handoffs stretch release timelines across multiple quarters, eroding early market advantages.
Tech teams can get ahead and speed up the strategizing process by compressing cycle time and eliminating handoff friction between product ideation, architectural review, and active software development phases. It increases engineering productivity, and accelerates the deployment of revenue-generating features before shifting competitive conditions render them obsolete.
Business Impact
Software engineering productivity must ultimately be judged by commercial performance rather than completed sprint tickets or code volume. Aligning developer execution with commercial telemetry transforms the global capability center from a back-office cost center into a strategic engine, combining:
- Revenue and Conversion Lift: Connects deployed digital features directly to customer acquisition rates, client retention, and top-line expansion.
- Operational Efficiency Gains: Verifies whether platform enhancements successfully reduce internal processing overhead and manual workforce effort across departments.
What Changes the Economics: The GCC 3.0 Model
The conversation around artificial intelligence in enterprise engineering is often framed incorrectly as replacing software developers. In reality, artificial intelligence fundamentally changes the amount of engineering leverage an organization generates from its existing talent pool. Rather than adding heads linearly to handle expanding backlogs, modern enterprises decouple software delivery velocity from total headcount growth. The strategic shift marks the transition from legacy workforce arbitrage to a capability-led GCC operating model that TechBlocks calls GCC 3.0.
Built on more than a decade of operating GCCs for Fortune 100 enterprises, TechBlocks developed the GCC 3.0 model to systematically eliminate delivery friction across the enterprise software lifecycle:
- AI-Augmented Pods: Cross-functional delivery squads embed generative coding tools and intelligent agents directly into daily development workflows to accelerate feature turnaround.
- Governed Centers of Excellence: Centralized CoEs codify reusable capabilities across Cloud, Data, AI/ML, DevOps, Quality Engineering, and Platform Engineering to prevent duplicated effort.
- End-to-End Automation: Continuous testing, site reliability engineering, DevSecOps, and release verification operate as automated pipelines, removing manual bottlenecks from developer workflows.
| Operating & Technical Dimension | Traditional GCC | TechBlocks’ GCC 3.0 model |
| Scaling Driver | Headcount-led expansion relying on linear hiring to grow delivery capacity across software portfolios. | Capability-led execution scaling delivery velocity through reusable platforms and autonomous engineering pods. |
| Operational Focus | Resource utilization tracking developer seat allocations, billable hours, and ticket completion counts. | Outcome-focused delivery measuring continuous release velocity, platform stability, and delivered commercial value. |
| Delivery Scope | Siloed project task execution governed by isolated tickets and slow cross-team handoffs. | Integrated product outcomes delivered through autonomous pods with end-to-end platform ownership. |
| Growth Dynamic | Linear workforce scaling that multiplies management layers, communication dependencies, and fixed overhead. | Reusable and AI-augmented scaling that expands delivery throughput without increasing headcount proportionally. |
| Enterprise Role | Back-office cost center primarily established to capture geographic labor arbitrage across regions. | Strategic capability engine driving continuous technological innovation, software leverage, and enterprise agility. |
The structural pivot redefines how a mature global capability center demonstrates value back to the enterprise teams. The TechBlocks’s GCC 3.0 model directly expands engineering velocity while accelerating enterprise time-to-value. Enterprises successfully escape the linear cost trap by combining automated guardrails with reusable architectural components and intelligent software delivery practices.
Is Your GCC Scaling Capacity or Complexity?
Expanding an enterprise engineering center often introduces organizational friction that quietly erodes the operational advantages captured through initial labor arbitrage. Traditional GCCs still deliver cost reduction, but over 40% of GCC enterprises now prioritize AI, data, and cybersecurity investments, signaling a move from pure capacity expansion to capability and value creation. To keep up, the remaining organizations need to systematically diagnose whether their global capability center is scaling productive engineering capacity or merely compounding organizational complexity.
An organization likely requires an updated GCC operating model when its delivery telemetry exhibits several clear operational warning signs:
- Stalled Release Velocity: Developer headcount expands across delivery squads each quarter, but software release cadence and deployment frequency remain entirely flat.
- Asymmetric Cost Growth: Total engineering expenditures climb rapidly while the measurable business value delivered by deployed software features fails to keep pace.
- Dependency Gridlock: Engineering teams spend excessive sprint hours negotiating architectural handoffs and resolving inter-service blockers instead of writing customer-facing production code.
- Redundant Capability Builds: Disconnected squads repeatedly develop duplicate internal platforms, data connectors, and tooling frameworks due to absent enterprise architectural governance.
- Isolated AI Experimentation: Artificial intelligence initiatives remain confined to speculative developer sandboxes rather than integrating directly into continuous software delivery pipelines.
- Input-Dominated Scorecards: Executive governance reports evaluate developer seat utilization and headcount growth rather than software delivery velocity, system stability, and commercial impact.
The operational symptoms reveal that sustainable enterprise scaling cannot be achieved by simply adding more developers to a legacy delivery model. The next stage of GCC transformation is not about building a larger workforce across lower-cost geographic regions. True maturity requires engineering organizations to unlock systemic leverage through reusable capabilities, integrated automation platforms, and outcome-based accountability.
Build a GCC Designed for Engineering Leverage
Moving beyond traditional labor arbitrage requires an operating framework engineered specifically for non-linear capacity growth and continuous software delivery. Winning enterprises thrive with AI-native GCC models built around outcome-led pods, reusable engineering capabilities, and measurable business impact across the enterprise software estate.
Explore GCC 3.0 with TechBlocks
Talk to a strategist today.
FAQs on Traditional Global Capability Centre
As capability centers expand, growing coordination overhead, redundant management layers, and communication silos steadily erode wage arbitrage savings. Consequently, overall operational costs scale faster than actual productive engineering capacity delivered to the enterprise.
As capability centers expand, growing coordination overhead, redundant management layers, and communication silos steadily erode wage arbitrage savings. Consequently, overall operational costs scale faster than actual productive engineering capacity delivered to the enterprise.
While traditional centers rely on linear headcount growth and time tracking, GCC 3.0 uses AI-augmented pods, governed CoEs, and automation to expand engineering velocity without proportionally inflating structural operational overhead.
Key symptoms include climbing headcount alongside stalled release frequency, rising delivery costs outpacing commercial outcomes, teams paralyzed by cross-functional dependency management, and AI initiatives remaining trapped within disconnected sandbox experiments.